TradingView Indicator · Pine Script v5
Precise BUY/SELL signals, no repainting
CISD + FVG + EMA combines Smart Money concepts with an EMA trend filter. Signals only appear after the candle closes, complete with automatic TP and SL.
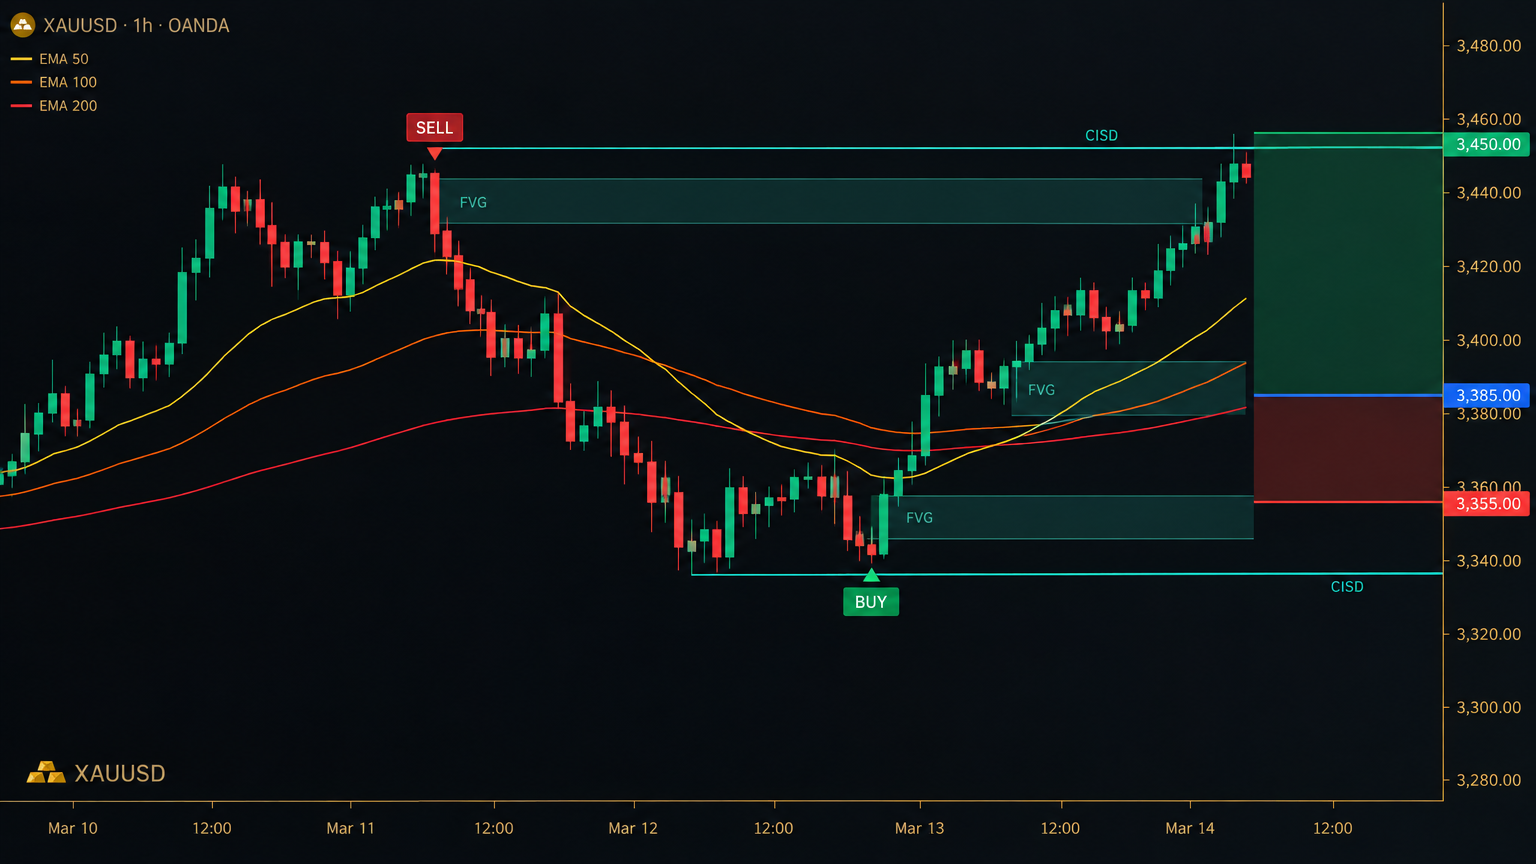
3 institutional methods, one indicator
Signals are confirmed only after the candle closes, so they are 100% non-repainting.
- 01
CISD
Change In State of Delivery as the main signal trigger.
- 02
FVG
Fair Value Gap to confirm imbalance zones.
- 03
EMA 20 / 50 / 200
Precise trend filter to minimize false signals.
Everything you need on your chart
Clear, automatic signals
BUY and SELL signals show directly on your chart, no guesswork.
Automatic TP & SL
Automatic Take Profit and Stop Loss calculation (Swing or ATR method) with an adjustable Risk to Reward Ratio.
Dual/Triple EMA & FVG filter
Optional trend filter with 2 to 3 EMAs plus FVG imbalance zones to minimize false breakouts.
Complete alert system
Instant phone or email notifications when a BUY/SELL signal appears or price hits TP/SL.
What it looks like
Entry & setup
A CISD break and FVG confirmation trigger a green BUY label below the candle.
Trade & risk management
Entry (blue), Stop Loss (red) and Take Profit (green) lines, with a "TP Hit" label.
Settings panel
Customize EMAs (20/50/200), FVG lookback, SL method (Swing/ATR) and Risk:Reward Ratio.
- Platform
- TradingView
- Script language
- Pine Script v5
- Instruments
- Forex/XAUUSD, Crypto, Stocks, Indices
- Timeframe
- All timeframes (M15, H1, H4 recommended)
Choose your license
Lifetime
Most popular$499
one-time payment, lifetime access
- Non-repaint BUY/SELL signals
- Automatic TP & SL
- Phone & email alerts
Automatic delivery
- 1Enter your TradingView username at checkout.
- 2Indicator access is granted via invite-only script within 24 hours.
- 3The installation guide is sent to your registration email.
FAQ
Does this indicator repaint?
No. Signals are only confirmed when the candle closes (bar close).
Can beginners use it?
Very easily. Just follow the BUY/SELL signals and the TP and SL lines shown on your chart.